Hey Folks!
Introduction
Market dynamics is crucial in today's world. By analyzing these dynamics, investors can gain valuable insights into potential risks and opportunities. In this post, I'll try to combine my passion for programming with my brewing interest in finance. My first medium post takes you through a simple analysis of HDFC Bank's shares and their comparison with the Indian benchmark index- Nifty 50. Why HDFC Bank? It is one of the most prominent players in India and its performance often determines the performance of the whole Banking industry. Why Nifty 50? It is a well-diversified index of the top 50 Indian companies and provides a valuable perspective on its relative risk and potential.
With the help of Yahoo Finance, and DA python libraries, I've tried to complete this task of comparing the performance of HDFC bank shares and Nifty 50. I've also tried to calculate an important volatility indicator known as Beta. It measures the volatility of a specific stock's price movements relative to the whole market.
A beta of 1 indicates that the stock moves in line with the market, while a beta of less than 1 suggests a lower volatility. A beta of greater than 1 implies higher volatility and risk associated with the stock.
Data Fetching
def fetch_stock_data(ticker, start_date, end_date):
    stock_data = yf.download(ticker, start=start_date, end=end_date)
    return stock_data['Close']
The first code block defines a function that takes 3 arguments - ticker, start date, and end date. It is used to fetch historical data for a given ticker symbol within a specified date range.
def calculate_returns(closing_prices):
    returns = closing_prices.pct_change()
    returns = returns.dropna()
    return returns
The second function calculates the percentage change of each closing price compared to the previous day and drops any NaN values.
def calculate_beta(hdfc_returns, nifty_returns):
    data = pd.concat([hdfc_returns, nifty_returns], axis=1).dropna()
    X = data.iloc[:, 1].values.reshape(-1, 1)  # NIFTY-50 returns
    y = data.iloc[:, 0].values.reshape(-1, 1)  # HDFC Bank returns
    model = LinearRegression().fit(X, y)
    beta = model.coef_[0][0]
    return beta
The third function combines the returns of HDFC bank and Nifty 50 into a single data frame and makes it suitable for the Linear Regression model provided by the Scikit Learn library. In mathematical terms, the beta coefficient represents the slope of the regression line.
These 3 functions form the basis for the whole analysis. There are a few other things too like the comparison graph of HDFC Bank and Nifty 50 and a way to visualize the linear regression model and the relationship between the 2. You can check out the rest of the code here: https://github.com/akshatg5/Python_Finance/blob/main/beta.ipynb
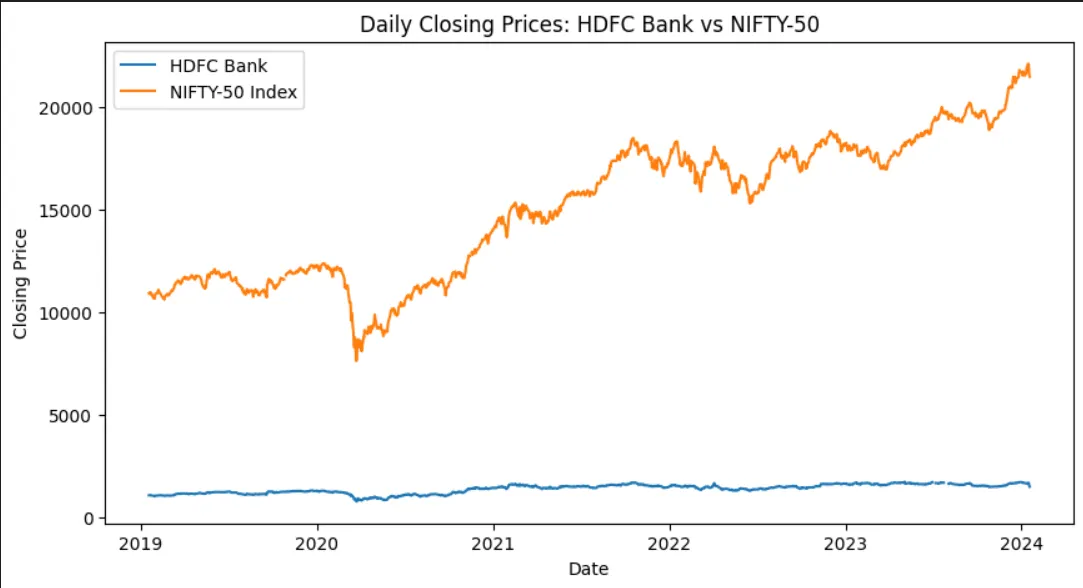
Visualization
Conclusion
That concludes my first Medium post! Will keep on doing this more often and work on my coding as well as financial knowledge. This was just an attempt at using Python to do some Financial analysis and not any kind of recommendation. I am currently a final-year Electrical and Communication Engineering student.
Any suggestions on how I can improve in terms of coding, writing, and market analysis are welcome. Thank you!
The content provided in this post is intended for informational and educational purposes only. It is not to be considered as financial advice, a solicitation, or an offer to buy or sell securities or other financial instruments